
Your Keg Does Not Yield 124 Pints. Here Is What It Actually Yields.
Every pour cost number in your building starts with a figure nobody in your building has ever measured.
A half barrel holds 15.5 gallons. The Brewers Association Draught Beer Quality Manual puts that at 1,984 ounces. Divide by 16 and you get 124 pints.
That 124 sets your cost per pint. Cost per pint sets your menu price. Menu price sets your pour cost target. And your pour cost target is how you decide whether a location is performing and whether a GM is doing their job.
The number is wrong at every location you operate. It is wrong by a different amount at each one. Nobody on your team can tell you by how much.
What 124 quietly assumes
The arithmetic is fine. 1,984 divided by 16. The manual is right.
It is also physics, not operations. To actually sell 124 pints out of one half barrel, every one of these has to be true:
No foam pour gets dumped and poured again
No beer goes to the drain at line cleaning
No product purges at keg change
No foamy tail at the end of the keg
No over-pour, including the free pour that fills past the line
No comp, sample or taster goes unrung
No after-hours pour
No pressure or temperature drift causes foam
Every item on that list is a physical ounce that left the keg. A flow meter sees it. Your POS does not. The gap between those two numbers is your real yield, and it is measurable.
Nobody publishes what the gap actually is
Sit with this part.
The Brewers Association manual gives you the volume of a keg and 165 twelve-ounce servings. It gives you no loss figure, because it is a quality manual, not a measurement study.
Bar inventory vendors publish the method for calculating shrinkage, then fill the worked example with invented ounces. The method is sound. The numbers in it are not from anywhere.
Backbar gets closest to a real answer. Its guidance is that variance from spillage, breakage and comps should land 1 to 1.5 points above your theoretical pour cost. That is the only published tolerance in this category. Hold onto it.
What nobody publishes is a measured yield. Until recently nobody could. Beer is largely invisible between the keg and the glass.
So we measured it
Floteq USA monitors draft systems at the milliliter level and converts to ounces . Here are two venues, real and anonymized, over comparable windows.

Poured vs. sold across client venues
Same product category. Same equipment class. Same 124 pints in both budgets. Nearly 17 points apart in reality.
One keg. Plain math.
A $150 half barrel and a $7 pint. That is the whole example.
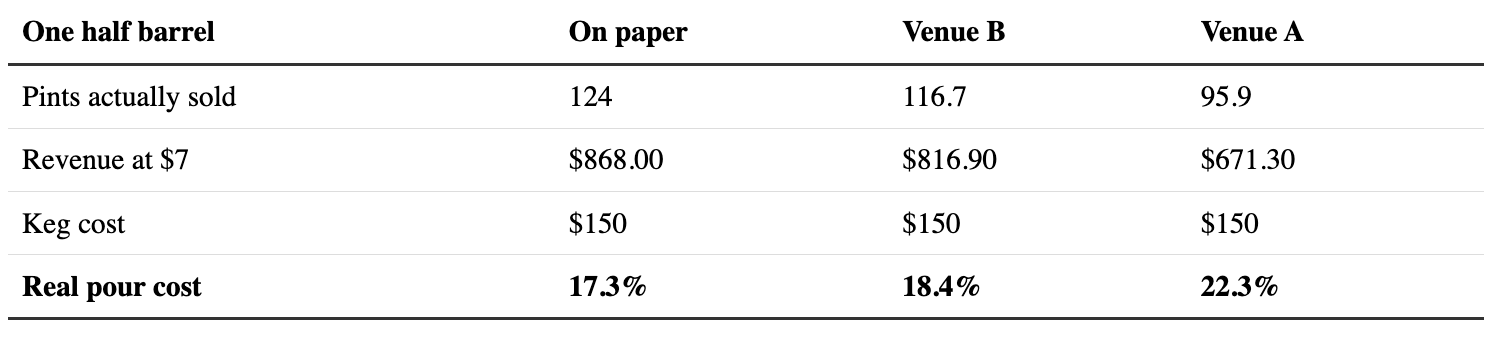
Draft pour cost vs. sales realities
Venue A believes it runs a 17.3% pour cost. It runs 22.3%.
Now bring back the only published tolerance in the category. Variance should sit 1 to 1.5 points above theoretical.
Venue B is 1.1 points above. It passes.
Venue A is 5.0 points above. It misses the published standard by more than three times.
Nothing on Venue A's P&L says so. The inventory count agrees with the invoice. The invoice agrees with the delivery. Everything reconciles except reality, because the P&L is built from the same 124 that created the error.
Being straight about Venue A's number
Venue A's capture rate includes a 58-day window where POS mapping was incomplete. Some of that unreconciled volume is a data gap, not lost beer. We could publish a larger number here. We are not going to.
Venue B is not perfect either, and perfect is not the target. Line pull is real. Cleaning loss is real. Roughly six points of Venue B's gap is physics. The goal is not zero. The goal is knowing your number instead of inheriting one from a textbook.
What one yield number does to a portfolio
Theoretical yield is identical everywhere. Real yield is not. Put Venue A and Venue B in the same group, priced off the same cost per pint and judged against the same target, and four things happen.
You are mispriced in both directions. Venue B is overpriced against its true cost and leaving demand on the table. Venue A is underpriced against its true cost and selling at a margin nobody approved.
Your best location subsidizes your worst, invisibly. Group margin looks fine because strong sites carry weak ones. Nobody sees the transfer, because nobody measures per site. That is draft drift.
Your scorecard punishes the wrong person. The GM at Venue A is not failing at management. They run a building with a mechanical problem that no amount of effort behind the bar will fix. Hold them to Venue B's number and you will lose them.
You negotiate on fiction. You buy kegs against theoretical consumption. Real consumption per revenue dollar is worse at your weak sites, so your effective cost is higher than the rate card implies.
Draft is the last cost center still running on theory
Kitchens stopped costing plates off theoretical recipe yield years ago, because the gap between theory and the plate was where the money sat. No operator today would accept a food cost that assumed zero trim, zero spoilage and zero over-portioning.
Draft still runs that way. It survived because the product was invisible between the keg and the glass. That constraint is gone.
What you get from measuring outlasts the beer you recover. Recovered ounces are a one-time win. A real cost basis changes every decision after it. You can price by market and by cost, hold GMs to a number they control, negotiate on real consumption, and underwrite a new site's draft economics before you sign the lease.
What to do this month
Estimate your own gap. Convert last month's keg purchases to ounces and compare against draft ounces sold in your POS. Inventory timing will distort it. The magnitude still tells you whether to keep going.
Run it per location. The group average will look survivable. The spread is the finding.
Reprice one tap. Take your highest-volume line, recalculate cost per pint at your measured capture rate, and look hard at the margin you thought you had.
Decide what would change. If a five point pour cost error would not change a price, a contract, or a conversation with a GM, do not spend money measuring it. If it would change all three, you already have your business case.
124 is not a lie. It is a ceiling. The only question that matters is how far under it you actually operate, and whether you can name that number for every location you own.
Sources
Keg volume, servings per half barrel and system standards: Brewers Association, Draught Beer Quality Manual
Acceptable variance above theoretical pour cost: Backbar, Pour Cost Targets
Capture rates, pints per half barrel and the 1,085,657 measured ounces: Floteq USA monitored venue data
PourScore™ measures every ounce that leaves the keg and reconciles it against POS sales in real time, per line and per location. Schedule a demo to see it running on a real venue.
